
Tableau
Tableau Desktop is an awesome data analysis and data visualization tool. It allows you to see your data immediately (with a few drag and drops). The “Show Me” feature is extremely helpful especially for those just starting out with Tableau. Once you drag in or double click on the dimensions and measures that you want in your analysis, you can use the Show Me feature to see the available charts that you can create by simply clicking on the chart types.
One thing you’ll notice is that some charts will be highlighted and some will appear to be more faded. The highlighted charts are the ones available for your use. This is determined by the number of measures, dimensions, bins, etc. that you have placed in your view. Each chart has a minimum specified number of dimensions, measures, bins, or other items that it needs in order to build that chart. As you hover over each view type, the description at the bottom shows the minimum requirements.
Note: Tableau is a paid software but we can use "tableau public" which is free and open source. but features are limited i.e only a few types of charts are available. link
Types of Charts


There are 24 available charts in Tableau’s Show Me feature. Let’s discuss when we should be using each of these charts and what the minimum requirements are in terms of measures and dimensions — keep scrolling down :)
Text Table (Crosstab)


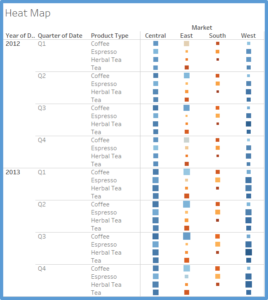
Heat Map

Highlight Table


Symbol Map


Filled Map


Pie Chart


Horizontal Bar Chart


Stacked Bar Chart


Side-by-Side Bar Chart


Treemap


Circle View


Side-by-Side Circle View


Line Chart (Continuous)


Line Chart (Discrete)


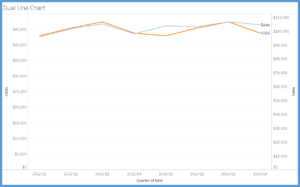
Dual Line Chart

Area Chart (Continuous)


Area Chart (Discrete)


Dual Combination


Scatter Plot


Histogram


Box-and-Whisker Plot


Gantt Chart


Bullet Graph


Packed Bubbles


No comments
If you have any doubts, Please let me know