
Forcasting using fbprophet

import pandas as pd
from fbprophet import Prophetdf = pd.read_csv('./data/footfall.csv')

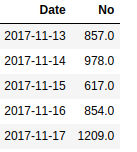
We’ll rename the columns to ‘ds’ and ‘y’ as required by the FbProphet. We’ll use the built-in weekly and yearly seasonalities and add a custom monthly seasonality as well. The period will be 30.5 (avg of 30 & 31) and we’ll use a Fourier order of 5. We’ll also add country holidays.
m = Prophet(weekly_seasonality=True,yearly_seasonality=True)
m.add_seasonality(name='monthly', period=30.5, fourier_order=5)
m.add_country_holidays(country_name='UK')
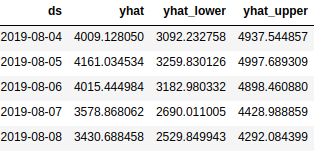
m.fit(df[['ds', 'y']])FbProphet will return predictions as yhat with upper and lower uncertainty levels (yhat_upper & yhat_lower).
#predicting for the next 100 days from 2019-04 to 2019-08
future = m.make_future_dataframe(periods=100, include_history=True)
forecast = m.predict(future)
When we keep include_history as True in prediction, the model does an in-sample fit as well (gives predictions for the training dataset as well). You can use this to judge better how well the model has fit both the past and future data.
Let’s do some plotting to better understand the results
fig1 = m.plot(forecast)
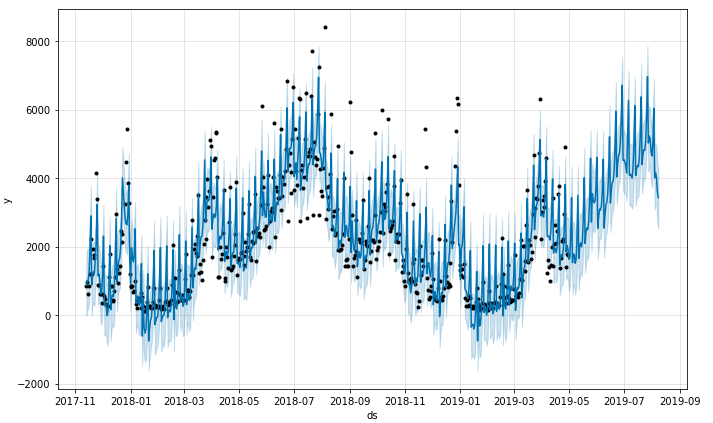
fig2 = m.plot_components(forecast)
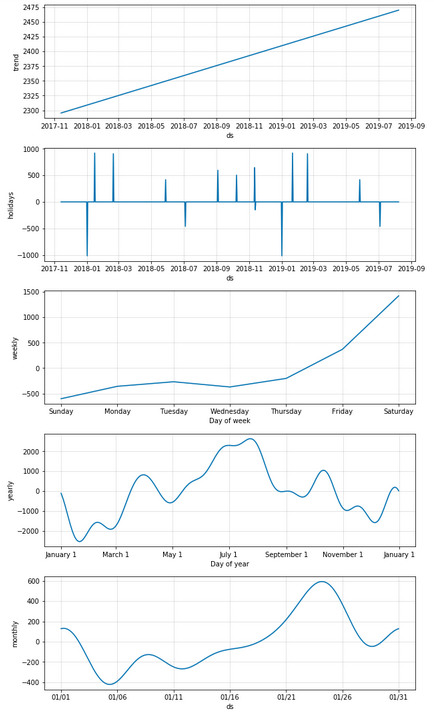
We can see the footfall count is generally increasing over the years. We can also see from the weekly seasonality plot, that the model has learned correctly a high footfall trend for the weekends.
There are a lot of options available for training a FbProphet model, from regressors to changepoint_prior_scale.
Resources:
- https://facebook.github.io/prophet/docs/quick_start.html
- https://machinelearningmastery.com/time-series-forecasting-with-prophet-in-python/


No comments
If you have any doubts, Please let me know