
K-Nearest-Neighbors

KNN:
K Nearest Neighbors (KNN) algorithm is a supervised machine learning algorithm. KNN algorithm requires an entire data set for the training phase. Once we provide the training set for the given K value, KNN Algorithm will search for the entire data set for K most similar measure. Here K is the number of nearest neighbors. This K nearest neighbor will be identified by using the distance measure like euclidean distance. Some use cases of KNN Algorithm: when we go to any e-commerce website and search for any product, they provide or suggest a few recommended relative products.
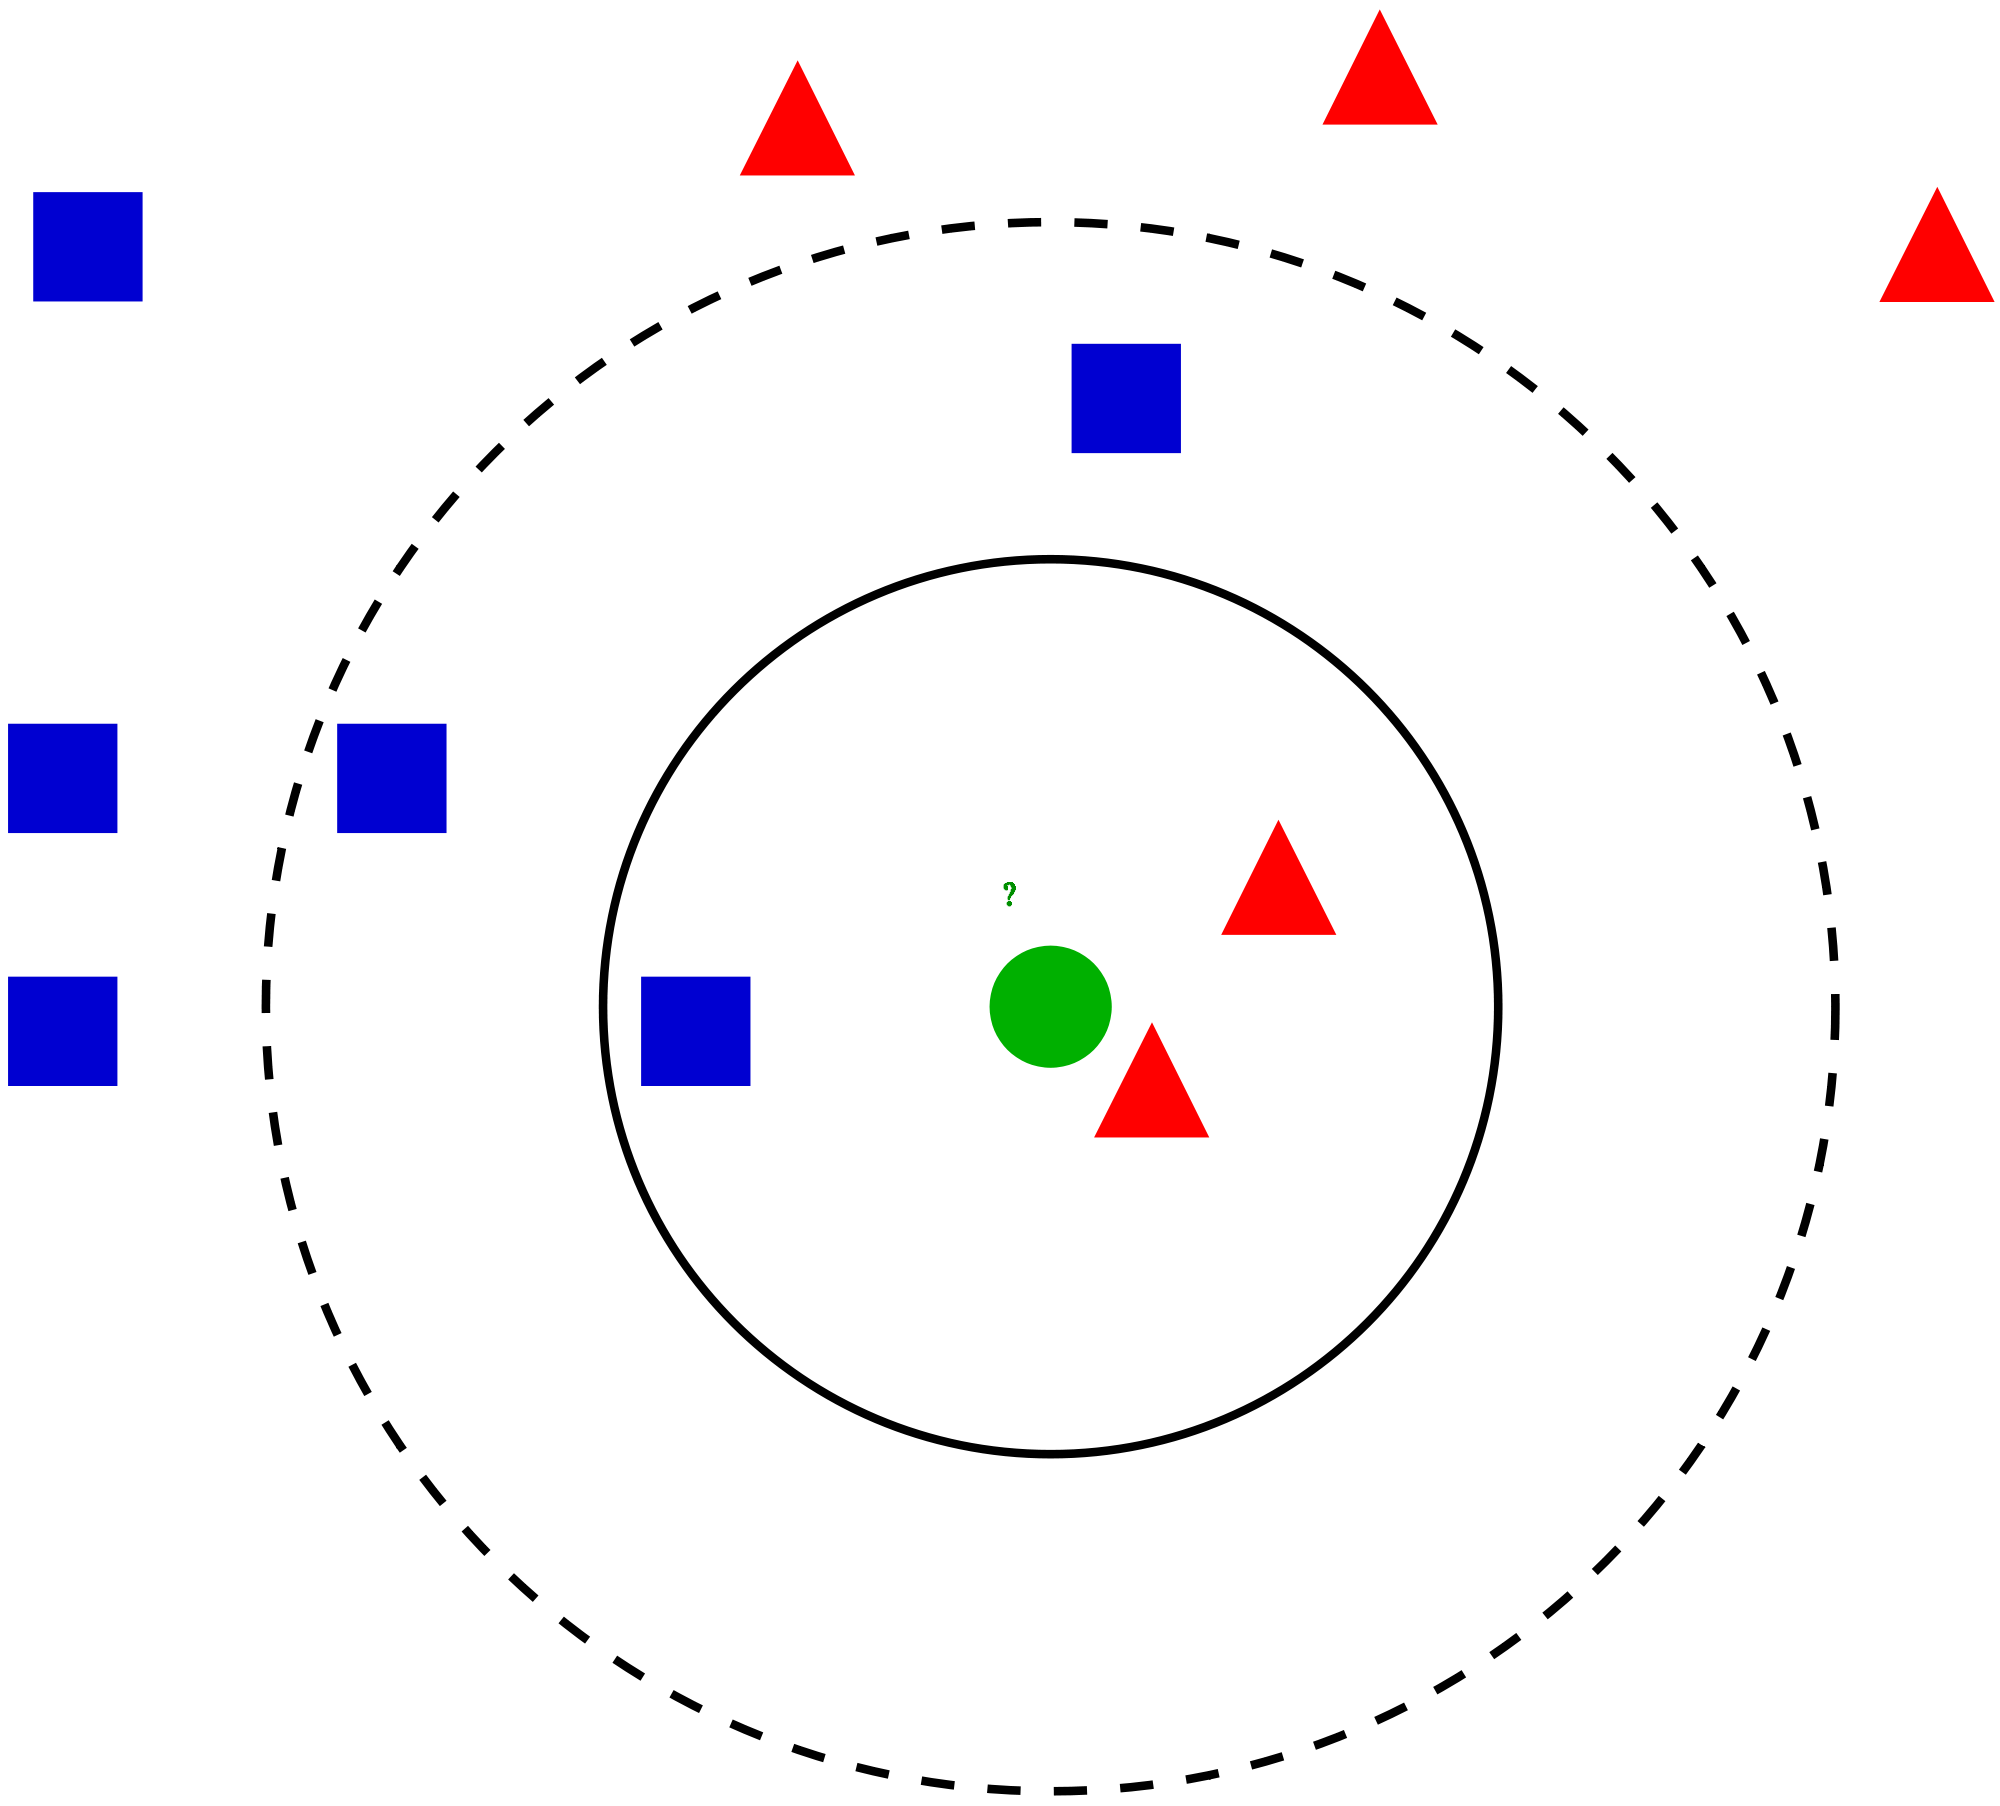
How does the KNN algorithm work?


Pseudo Code of KNN
- Load the data
- Initialize the value of k
- For getting the predicted class, iterate from 1 to total number of training data points
- Calculate the distance between test data and each row of training data. Here we will use Euclidean distance as our distance metric since it’s the most popular method. The other metrics that can be used are Chebyshev, cosine, etc.
- Sort the calculated distances in ascending order based on distance values
- Get top k rows from the sorted array
- Get the most frequent class of these rows
- Return the predicted class.
KNN Using Numpy:
import io
import pandas as pd
import matplotlib.pyplot as plt
from scipy.spatial.distance import cdist
import numpy as np
from scipy import stats
df1 = pd.read_csv(io.BytesIO(uploaded['train.csv']))
df2 = pd.read_csv(io.BytesIO(uploaded['test.csv']))
a = df1.values
b = df2.values
labels = a[:,0]
train = a[:,1:]
x = train[labels==0]
y = train[labels==1]
z = train[labels==2]
plt.plot(x[:,0],x[:,1],'o',color='red')
plt.plot(y[:,0],y[:,1],'o',color='green')
plt.plot(z[:,0],z[:,1],'o',color='blue')
plt.plot(b[:,0],b[:,1],'x',color='black')
plt.show()
d = cdist(b,train)
e = d.argsort(axis=1)
# k=3
f = e[:,:3]
labels[f]
mode = stats.mode(labels[f],axis=1)
w = mode[0]
u = w.reshape(-1)
print(u)
q = b[u==0]
r = b[u==1]
t = b[u==2]
plt.plot(x[:,0],x[:,1],'o',color='red')
plt.plot(y[:,0],y[:,1],'o',color='green')
plt.plot(z[:,0],z[:,1],'o',color='blue')
plt.plot(q[:,0],q[:,1],'x',color='red')
plt.plot(r[:,0],r[:,1],'x',color='green')
plt.plot(t[:,0],t[:,1],'x',color='blue')
plt.show()
hmm=train[e[0]]
print(hmm)
for i in range(9):
plt.plot(q[:,0],q[:,1],'or')
plt.plot(r[:,0],r[:,1],'og')
plt.plot(t[:,0],t[:,1],'ob')
plt.plot(b[i,0],b[i,1],'xr')
hmm=b[e[i,:3]]
for j in range(3):
plt.arrow(b[i][0],b[i][1],(hmm[j][0]-b[i][0]),(hmm[j][1]-b[i][1]))
plt.show()
KNN Using scikit-learn:
import numpy as np
import pandas as pd
from sklearn.model_selection import train_test_split
from sklearn.neighbors import KNeighborsClassifier
import matplotlib.pyplot as plt
import seaborn as sns
cd C:\Users\Dev\Desktop\Kaggle\Breast_Cancer
# Changing the read file location to the location of the file
df = pd.read_csv('data.csv')
y = df['diagnosis']
X = df.drop('diagnosis', axis = 1)
X = X.drop('Unnamed: 32', axis = 1)
X = X.drop('id', axis = 1)
# Separating the dependent and independent variable
X_train, X_test, y_train, y_test = train_test_split(
X, y, test_size = 0.3, random_state = 0)
# Splitting the data into training and testing data
K = []
training = []
test = []
scores = {}
for k in range(2, 21):
clf = KNeighborsClassifier(n_neighbors = k)
clf.fit(X_train, y_train)
training_score = clf.score(X_train, y_train)
test_score = clf.score(X_test, y_test)
K.append(k)
training.append(training_score)
test.append(test_score)
scores[k] = [training_score, test_score]


No comments
If you have any doubts, Please let me know